Abstract
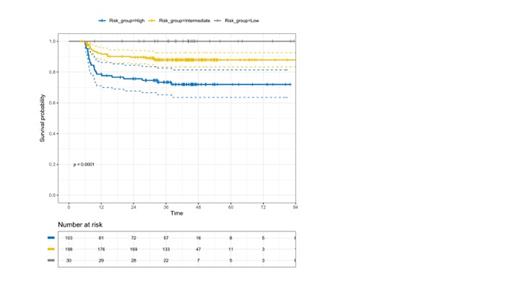
Background: Despite its high overall accuracy in predicting ABVD outcome in advanced stage Hodgkin Lymphoma (HL), interim PET performed after 2 chemotherapy cycles (PET-2) showed a sub-optimal negative predictive value (PV) on treatment response. In fact, PET-2 negative patients (p.) treated with six ABVD cycles in four prospective trials (RATHL, GITIL/FIL HD 0607, SWOG 0816 and Echelon-1), showed a 3-Y PFS ranging between 79% to 87%, even declining to 74% after a 5-year follow-up (Stephens 2019). A high Total Metabolic Tumor Volume (TMTV) calculated in baseline PET (cutoff value 471 ml.) , along with a high IPS (≥2) proved able to identify a small p. subset (7%) of PET-2 neg. p. with a 3-Y PFS of only 56% (Gallamini 16° ICML, 2021). A new TMTV-derived parameter aimed to image tumor spread, the tumor distance (DMAX), proved able to predict ABVD outcome in a retrospective series of HL p. from a single center (Durmo, 16° ICML 2021). We report here the PV on ABVD outcome of DMAX combined with IPS in a large cohort of PET-2 negative p. prospectively enrolled in the HD0607 clinical trial. Methods: Out of 783 p. with advanced HL (IIB-IVB) included in the HD0607 clinical trial (NCT00795613), 630 (81%) of them with both negative PET-2 and end-of therapy PET, were randomly assigned to no further therapy or consolidation radiotherapy over the area of a large nodal mass detected at baseline. A single experienced nuclear medicine physician calculated DMAX and TMTV in 331 out of 630 (52%) PET-2 negative p. in which the baseline PET images were available for review. Three different tumor segmentation methods for TMTV computing were chosen, with (1) a relative threshold of 41% of SUVmax in each lesion, (2) a fixed threshold of SUV=2.5 or (3) of SUV=4. DMAX was calculated as the maximum distance among any pixel of the tumor belonging to any lesions in the body. Results: The demographics of the 331 p. included in the present study and of the overall cohort of 630 PET-2 negative p. were: median age 31 (14-60) Vs. 31 (14-60), M/F ratio 0.86 Vs. 0.89; WHO Performance Status 0-1 91.5% Vs. 91.4%; B-symptoms 81.8 Vs. 81.1%; Stage IIB, III and IV 35.0, 35.0, 29.9, Vs.36.3, 33.0 and 30.0%; IPS 0-1 39.3 Vs. 39.8%, IPS 2-3 48.3 Vs. 49.4%, IPS >3 12.4 Vs. 10.6%, Bulky 18.1 Vs. 17.9%. No difference in 6-y PFS was found for p. randomized to NFT or cRT (p=.48; Gallamini JCO 2020). After a median follow-up of 40.6 (4.8-87.2) months, the 3-Y PFS for the 331 p. included in the present analysis and for all the 630 PET-2 negative p. was 84% (95% CI 81% to 87%) and 87% (95% CI, 84% to 89%), respectively. Treatment failure was recorded in 51/331 (15.4%) and 81/627 (12.9%), respectively. Based on a ROC analysis the three different segmentation methods for MTV computing proved to be equivalent (AUC values 0.620-0.525) and hence the 41% threshold was chosen for consistency with previous works. Median and average DMAX values were 12.5 cm. and 15.3 cm. The most accurate cutoff value for DMAX to predict treatment outcome (3-Y PFS) was 16.2 cm., with an AUC of 0.62 (95% CI 0.53-0.70). With this cutoff value DMAX was able to identify two cohorts of patients with a statistically different 3y-PFS: 90% (CI 85-93%) and 76% (95% CI 69-85%), p < 0.001. In multivariate analysis (Cox regression model) including all the above demographics and clinical parameters, as well as TMTV and DMX, only DMAX turned out significant in predicting relapse, with a HR of 1.46 (95% CI1.06-2.01), p=0.02. Upon combining DMAX (higher or lower than 16.2 cm.) and IPS (0-1 Vs. ≥2) in a two-factor predictive model, three categories of p. with a statistically different treatment outcome (P < 0.0001) have been identified: (1) both low DMAX and low IPS, N =30 (9%), 3-Y PFS 100% (95% CI 96-100); (2) either high DMAX and low IPS or high IPS and low DMAX, N= 198 (60%); 3-Y PFS 88% (95% CI 83-93), and (3) both high DMAX and IPS, N= 103 (31%); 3-Y PFS 72% (95% CI 65-82), p<0.0001. Conclusions: DMAX and IPS combined in a predictive model were able to single out three classes of PET-2 negative p. with a statistically different ABVD outcome. P. with a high MTV and a high DMAX, accounting for nearly one-third of p. included in the study, showed the highest risk of failing ABVD, with only 72% of them sustaining a long-term disease control at three years, thus deserving a more aggressive or innovative treatment. The remaining two-thirds had a very good outcome, with a 3-y PFS of 90%, thus stressing that ABVD could remain the standard of care for most PET-2 negative p.
No relevant conflicts of interest to declare.


This feature is available to Subscribers Only
Sign In or Create an Account Close Modal